Written definitions
What counts as “done,” an error, and which cases are in scope — agreed before the pilot starts.
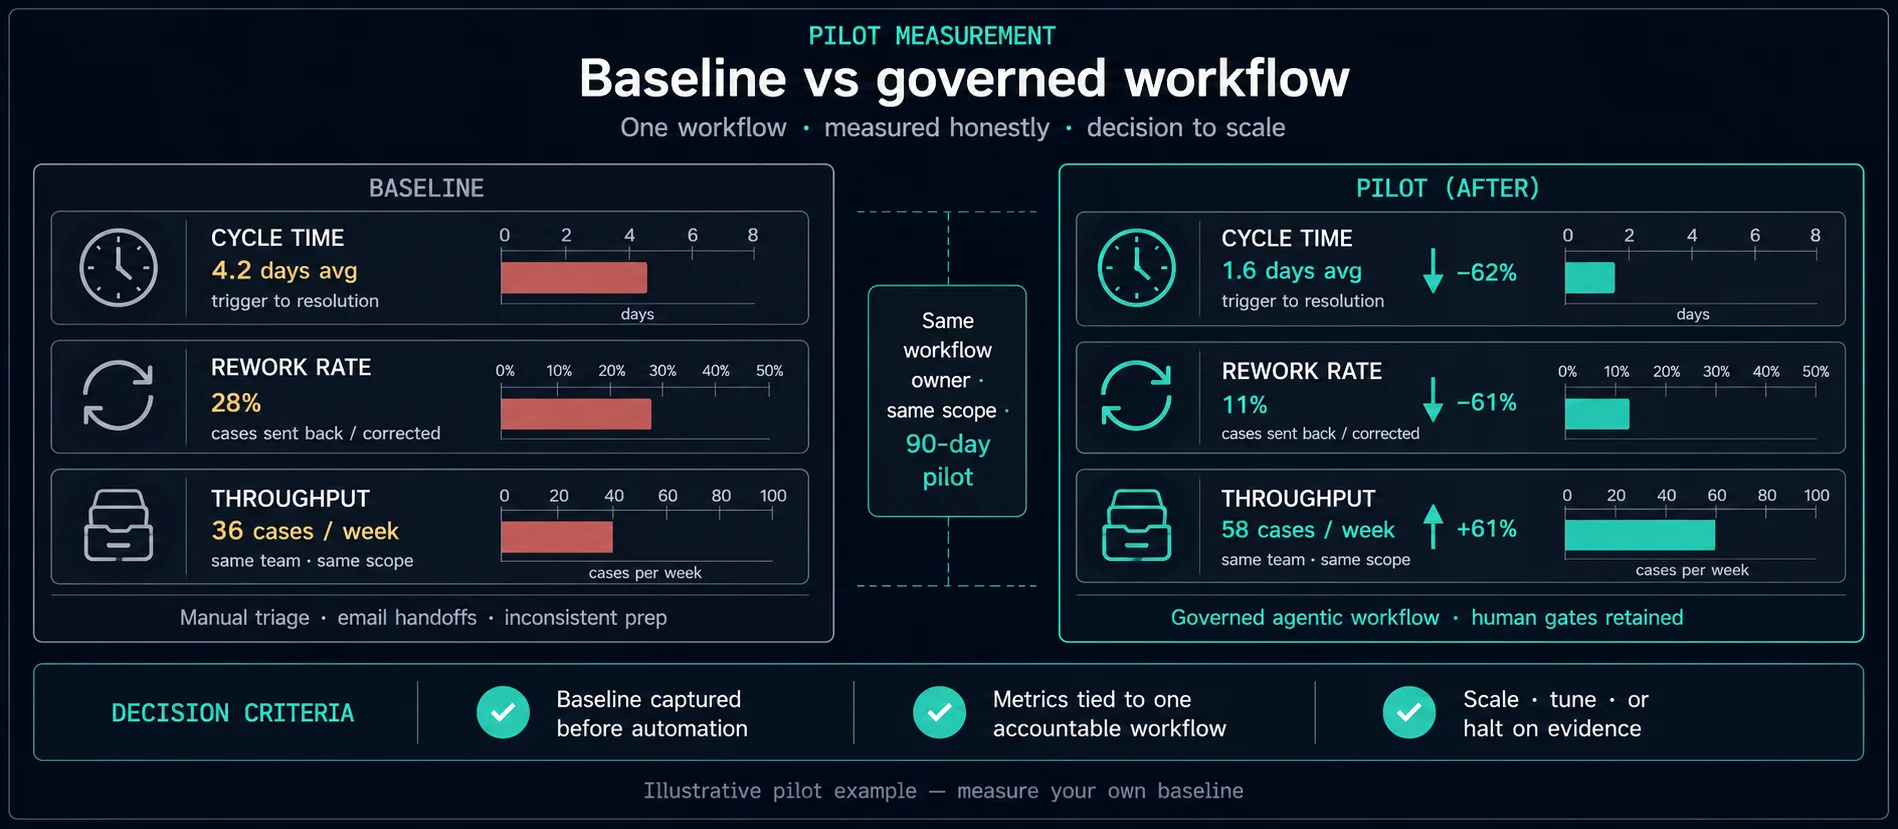
Baseline discipline, leading vs lagging indicators, quality gates paired with speed, side-by-side running, and explicit stop rules — so metrics survive steering meetings after the novelty wears off.
Reading path: Midlands SME playbook → this article → How we work
By week eight, leadership stops asking which model you used. They ask whether capacity, cost, or risk moved. If your KPI story rests on “hours saved” nobody measured before automation, credibility erodes fast.
Rule of two: pick two primary KPIs finance or operations already reports — time-to-complete plus rework rate, or throughput plus satisfaction on the affected journey. Everything else is diagnostic.
What counts as “done,” an error, and which cases are in scope — agreed before the pilot starts.
Multiple weeks covering normal variation. Quiet fortnights make pilots look heroic and break trust later.
Queue depth, first-response time, escalation rate — steer weekly operations.
Cost per case, margin, NPS — investment narrative; moves slower than leading metrics.
Automation that only optimises speed can increase rework or compliance risk. Pair every throughput or time KPI with one quality measure: error rate after review, rubric pass rate, or audit sample pass rate.
Define the pair before go-live so nobody moves goalposts when the first edge case hurts.
Run the new path alongside the old for a bounded period. KPIs compare like with like on the same population — not a before/after story confounded by seasonality or staff churn.
When side-by-side is not possible, document every assumption in the “before” snapshot. When workloads touch cloud components, align observability with your architecture — see cloud AI delivery.
Team still “tuning prompts” while queue depth unchanged — often integration or ownership, not model capacity.
Primary KPI improved but rework rose — pause scale until you know if model, data, or boundary is wrong.
Each status meeting adds a new metric — freeze the headline pair unless leadership changes criteria.
Define “no signal” upfront — protects budget and credibility for the next workflow.
Fewer ticket types or one region often rescues a pilot that swallowed too much scope.
Leicester or wider Midlands — one owner, baseline, two KPIs, quality gate, stop rule.
Applied workflows: lead qualification · month-end anomaly · solutions index
Book a consultation to agree baseline KPIs, quality gates, and stop rules before automation starts.
Book AI Consultation